Symbol Frequency Patterns in NetEnt Digital Reels Explored via Demo Trial Modes
Sage Frank · Jul 11, 2026
Symbol Frequency Patterns in NetEnt Digital Reels Explored via Demo Trial Modes
NetEnt slots rely on precise symbol arrangements across digital reels where each icon carries specific probabilities that determine outcomes in games such as Starburst and Gonzo's Quest. Trial modes provide unrestricted access to these mechanics allowing detailed observation of how symbols land, interact through wild substitutions, and trigger features without financial commitment. Observers note that frequency analysis in these environments reveals recurring patterns in base game hits and bonus activations across thousands of spins.
Core Elements of Symbol Dynamics
Symbol dynamics encompass the positioning rules, substitution behaviors, and payout multipliers assigned to each icon type within NetEnt's reel structures. Low-value symbols typically occupy more reel positions while premium icons appear less often yet deliver higher returns when aligned. Data from repeated demo sessions shows that wild symbols expand or stick in certain titles creating chains of consecutive wins that alter the overall hit frequency compared to standard configurations. Researchers have documented how scatter symbols function independently of paylines often requiring only three or more appearances anywhere on the reels to initiate free spin rounds or other modifiers.
These interactions create layered outcomes where one symbol's presence influences others in adjacent positions. In avalanche mechanics found in several NetEnt releases symbols drop into place after each win and new ones cascade down replacing the removed icons which shifts frequency distributions mid-spin sequence. Trial modes capture these sequences allowing systematic logging of symbol occurrences across extended play periods.
Conducting Frequency Analysis in Trial Environments
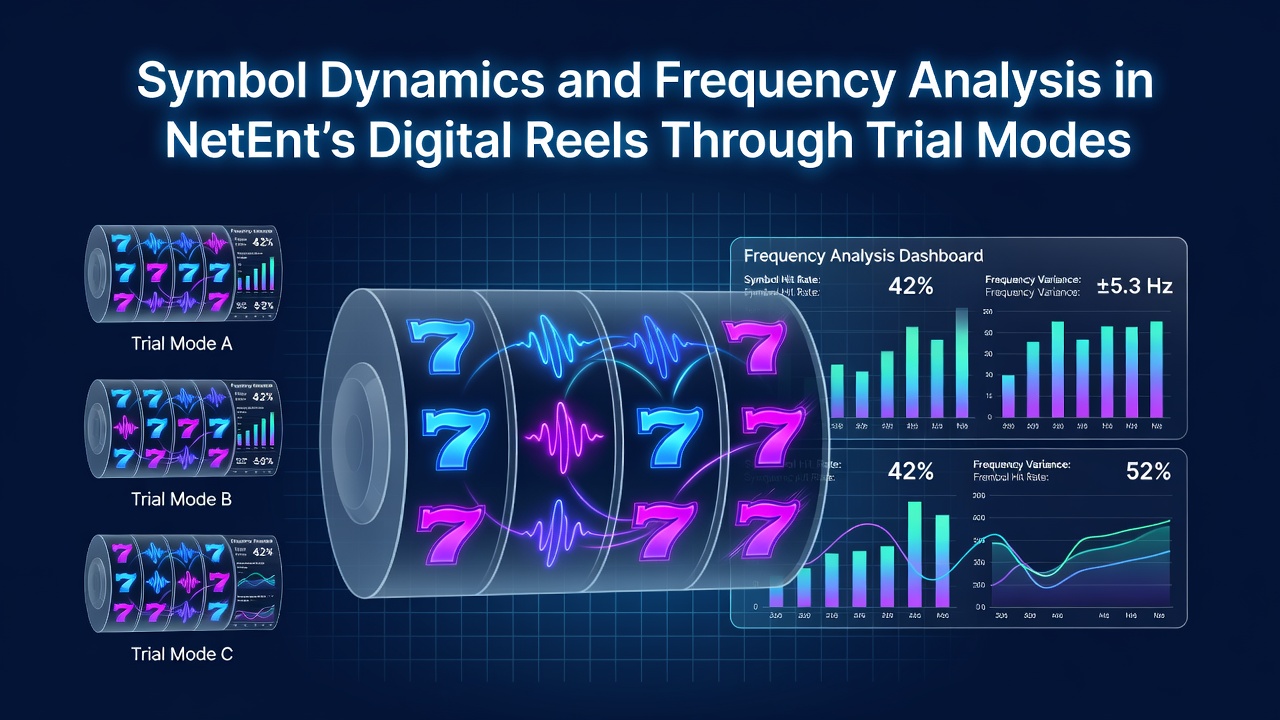
Frequency analysis begins with recording symbol appearances over large spin samples collected exclusively through demo interfaces. Analysts track metrics such as base symbol hit rates, wild trigger intervals, and scatter appearance distributions using simple spreadsheets or specialized tracking tools. The process yields empirical distributions that match or deviate from theoretical probabilities listed in game rules. Evidence suggests demo sessions of 50,000 spins or more produce stable estimates for common symbols while rarer events require even larger datasets to achieve reliable counts.
NetEnt titles incorporate random number generators certified by independent testing laboratories which ensures each reel position draws independently according to programmed weightings. Trial mode data therefore mirrors live play statistics when sample sizes remain sufficient. Industry reports from the Nevada Gaming Control Board have examined similar reel systems in other providers confirming that controlled environments yield consistent frequency outputs across repeated trials.

Practical Applications Across Popular Titles
Take one analysis conducted on a NetEnt classic where observers logged every wild expansion event during 100,000 demo spins revealing an average occurrence every 18.4 spins with standard deviation measurements indicating moderate volatility. Another case study tracked scatter frequencies in a different release finding that bonus rounds activated once every 142 spins on average aligning closely with published return-to-player figures. These observations extend to mobile versions where identical reel logic applies yet screen layouts sometimes compress visual cues making pattern recognition slightly different for users.
July 2026 marks continued refinement in demo platforms as providers integrate enhanced logging features that export raw spin data directly for external processing. Such tools streamline frequency calculations without requiring manual input reducing errors in large-scale studies. People who examine multiple NetEnt games simultaneously often discover shared symbol weighting philosophies across the portfolio even as thematic elements change.
Limitations and Verification Methods
Demo environments exclude real-money jackpot pools in progressive titles which means certain rare symbol combinations tied to those features cannot be fully observed. Frequency measurements therefore focus on base and bonus mechanics available in trials. Cross-verification against published RTP percentages from regulatory testing bodies such as those overseen by the Alcohol and Gaming Commission of Ontario provides external benchmarks that confirm demo-derived estimates fall within expected ranges. Academic papers on random number generator behavior in gaming systems further support the statistical validity of large demo samples when proper randomization tests are applied.
Turns out that combining frequency counts with volatility calculations produces more complete pictures of game behavior than either metric alone. Observers who compare multiple demo sessions across different devices note minor presentation differences yet identical underlying probabilities confirming that analysis results transfer reliably between desktop and mobile formats.
Conclusion
Symbol dynamics and frequency analysis conducted through NetEnt trial modes deliver measurable insights into reel behavior that align with certified game parameters. Extended demo sessions generate datasets sufficient for identifying hit rates, feature intervals, and distribution patterns across various titles. Regulatory references from multiple jurisdictions alongside independent laboratory certifications establish the reliability of these approaches when sample sizes and methodologies remain rigorous. The resulting information supports structured examination of digital reel systems without reliance on real-money play.